Research
Sustainable Mobility
On-Demand / Ride-Pooling Dynamics
On-demand ride-pooling services have the potential to drastically decrease urban traffic, mobility costs, carbon emissions and the need for owning a private car. In order to analyze and design ride-pooling dynamics, we develop and enhance analytical theories and also run numerical simulations. References: [1], [2], [3], [4], [5]
Our custom-made simulation framework is written in Julia, runs on OpenStreetMaps and is under active development. The project ideas below are still on our todo-list and are potentially well-suited for potential Bachelor and Master thesis’.
Non-uniform pickup/dropoff distributions: Each transport request consists of two locations: the sites for pickup (stars in .gif on the right) and dropoff (triangles) of the respective customer (color). While we currently draw both locations from a uniform distribution on the underlying street map, it is clear that this procedure should be improved. Firstly, the two locations are not independent but the distance between them follows e.g. an inverse Gamma distribution ([1], [2]). Secondly, in reality there may be train stations, theaters, airports etc. which present natural hotspots and should be taken into account.
How does the shareability of requests change when their pickup or dropoff locations tend to coincide? How much more efficiently can a system be operated when a certain amount of information/entropy is contained in the spatial distributions?
Graph centrality: After finishing their job by dropping off the last passenger on board, buses often become idle in remote areas. This is clearly disadvantageous as it hinders them from quickly getting to the next pickup-destination assigned to them. Keyword: graph centrality
Given a street map (graph), can we predict which nodes are often travelled through, or most likely to be temporally close to incoming requests? Can they be learned from simulated trajectories? Should idle buses relocate to hotspots per default?
Speed-up heuristics: When a new request is submitted, the algorithm minimizes a cost function on the set of all possible insertions. For many buses and frequent requests, this progress quickly becomes numerically expensive. The main reason for this is that -currently- all possible insertions are checked and evaluating the cost function over and over requires repeated route finding on a graph ([1], [2]).
Which options can be quickly discarded? How much quicker can clever heuristics make a simulation [1]? What’s the tradeoff between computational speed and service quality? Can frequently travelled fastest-routes be precalculated using a coarse-grained grid?
Rush-hour robustness: Given the request frequency and spatial distribution, it is possible to predict the fleet size required to serve the demand in a steady state. In reality, the demand depends on the time of the day as clearly more people require mobility in the afternoon than at 3am.
Can we quantify the robustness of the system against peaks of incoming requests? What are good strategies to have enough capacity in peak hours, but not overly many idle buses during times of low demand?
Re-ordering bus’ to-do lists: When a new request comes in and is assigned to a bus, the relative order of already-assigned jobs (picking up and dropping off users) remains unchanged (so far). Yet given the new set of tasks, it may be advantageous to re-optimize the order with which a vehicle performs its assigned jobs.
Is the extra efficiency worth the numerical effort? Is the computational problem even feasible for large systems?
Effective curvature of street networks
Analytical theories of ride-pooling such as in [1] mostly approximate the traffic space as the Euclidean plane. How can the geometry of the street network be characterized and incorporated into theories?
We are investigating whether an effective curvature can be a useful characterization. Based on trip durations obtained by routing machines like OSRM, we use an angular defect scheme to assign a Gaussian curvature to locations in the street network.
Using this scheme, can an effective curvature be defined consistently and in a practical manner? How does it behave? Which aspects of the street network geometry does it capture?
Social Networks
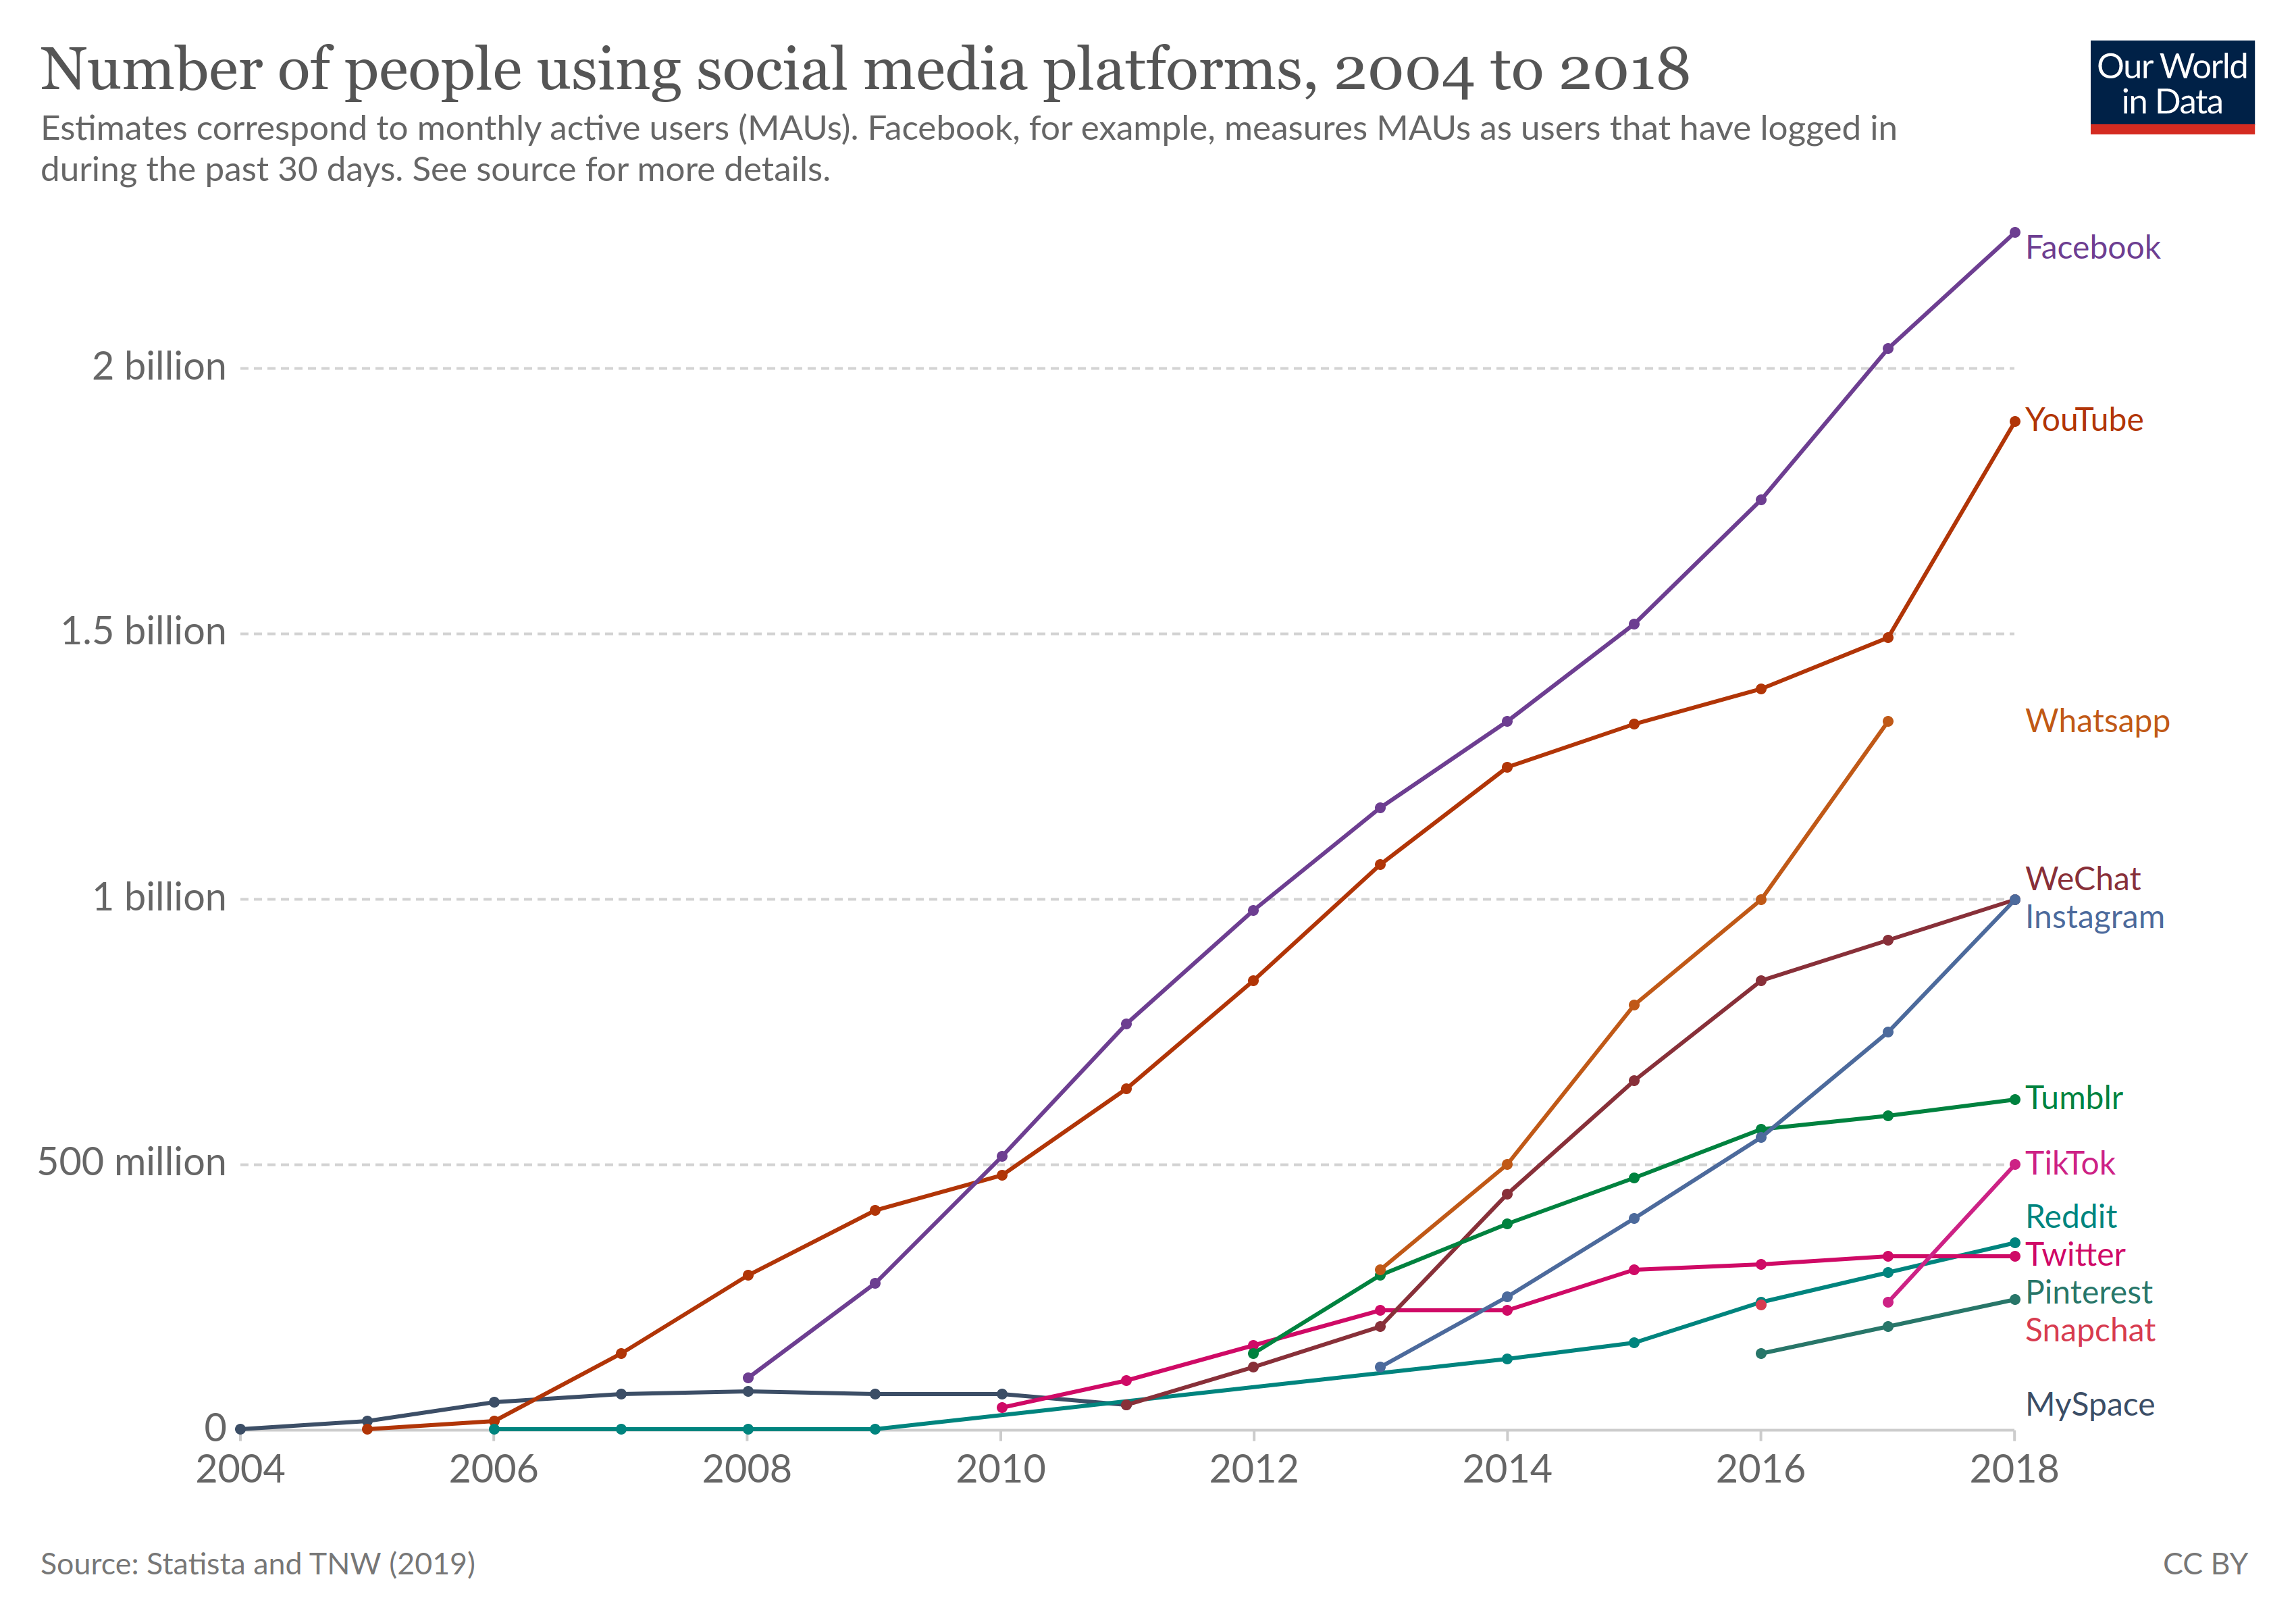
Figure: Evolution of social media, taken from Our World in Data.
Social networks have transformed the world, becoming the main way opinion is formed in our modern society (see Fig. 1). They bring a completely new set of societal challenges, as they can be used to manipulate opinion on a much larger scale than previously possible. We aim to use concepts from physics and network theory to understand how opinions spread in social networks. We focus on large and influential platforms, backing our modeling with large-scale data analysis. We are particularly interested in the following topics:
Discussion dynamics in Reddit communities: Reddit is one of most influential social media platforms in the world, and individual Reddit communities have been involved in some of the biggest social events in recent times (such as The_Donald and wallstreetbets). We use percolation models and data analysis to quantify how the discussion dynamics differs between communities. References: [1], [2].
Polarization and social tipping: We live in an increasingly polarized world. We are interested in models that reproduce such macroscopic polarization from microscopic mechanisms, and that offer insights into how polarization can be tackled. Related to polarization is social tipping, which refers to drastic changes in collective societal behavior. We are interested in the role of phase transition models in explaining social tipping. References: [3],[4].
Fake news spreading on Twitter: Fake news have a large impact on modern society. They have been used to hack elections, promote conspiracy theories and create social polarization. On Twitter, fake news have been observed to spread in a coordinated manner through the use of bots. We are interested in characterizing fake news on Twitter from its dynamical and topological spreading patterns. Reference: [5].